We begin with what is visible.
Price, returns, volatility and trend describe current behaviour. At this stage, MFM deliberately avoids attaching meaning.
Structural Thinking applied to financial markets
Markets are observed continuously. Price, trend, momentum and volatility can all be measured correctly — and still be interpreted poorly when the relevant structural context remains invisible.
The central question
Why MFM exists
Market participants often observe the same movement, the same trend or the same indicator reading. Yet they reach different conclusions. The difference is not always found in the observation itself. It is often found in the structural context used to interpret it.
Price, returns, volatility and trend describe current behaviour. At this stage, MFM deliberately avoids attaching meaning.
The same observation can carry a different meaning inside a supportive, neutral or unsupportive structural environment.
MFM compares observed trend with structural context instead of treating either as sufficient on its own.
Interpretation explains meaning, uncertainty and relevant boundaries. Decision-making remains outside the model.
From philosophy to method
MFM is the financial-market implementation of Structural Thinking: a formal journey that makes structural context explicit before interpretation, research and validation.
The Market Framework Model — Analysis Journey
Each stage changes the frame of reference. The journey moves from direct observation, through structure and trend, toward interpretation and the evidence needed to assess how far that interpretation can reasonably be supported.
Identify price behaviour, returns, volatility and other direct observations.
Classify the structural environment, phase and benchmark-relative position.
Identify observed direction, strength, duration and trend recognition.
Relate observed trend to structure and identify coherence or conflict.
Explain meaning, trade-offs, cautions and interpretive boundaries.
Study representation, duration, separation and temporal stability.
Assess sufficiency, robustness and justified research confidence.
Compare benchmarks, assets, providers and timeframes.
Separate directly measurable market behaviour from interpretation.Select a stage above to explore its role within the Analysis Journey.
Bring the complete Analysis Journey together in one coherent, evidence-aware interpretation—without turning it into a decision or recommendation.
The Market Framework Model — Analysis Engine
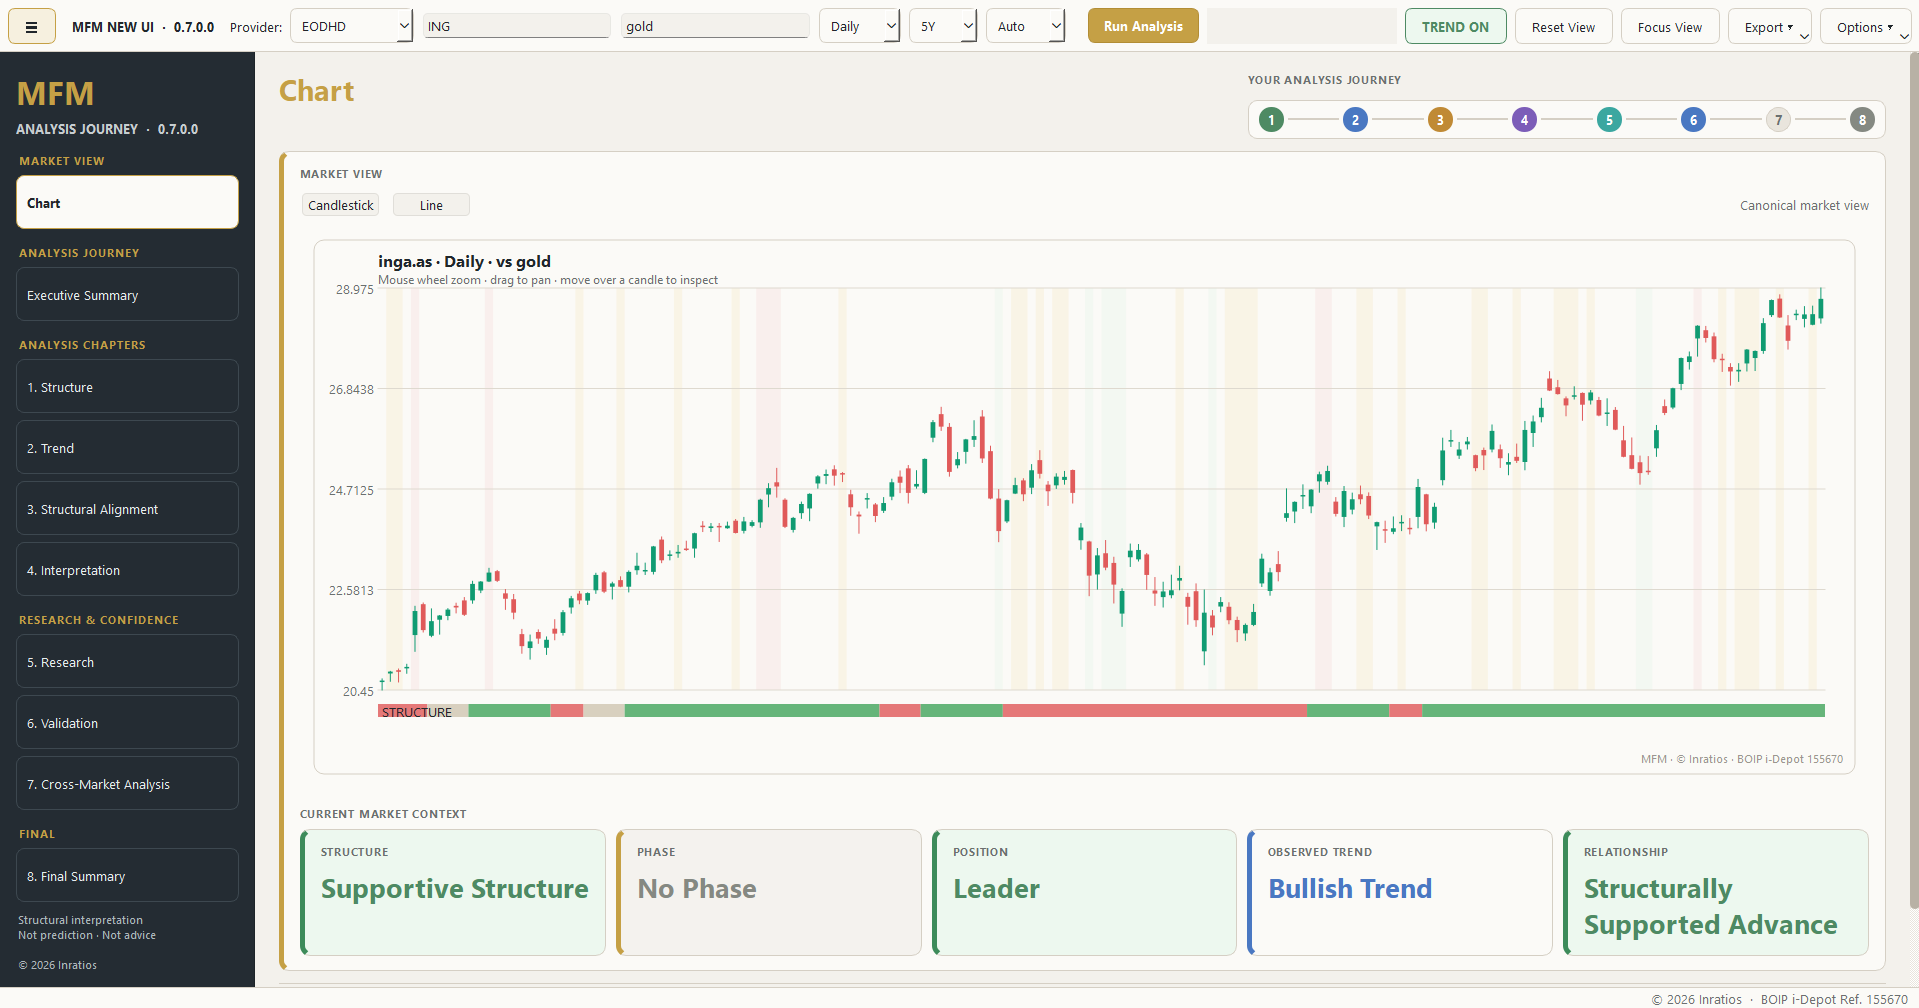
The Analysis Engine translates the philosophy into a practical workspace. It connects current-market analysis with benchmarking, internal research, validation and cross-market comparison in one coherent environment.
Current context, observed trend, structural alignment, interpretation and final summary.
Classification distribution, duration, temporal stability and separation within the selected dataset.
Compare an asset with a relevant benchmark to reveal relative position, leadership and structural divergence.
Evaluate whether structural behaviour remains coherent across assets, providers, benchmarks and timeframes.
Assess data sufficiency, reliability, parameter robustness, provider agreement and evidence depth.
Create structured exports for review, documentation and external analysis.
Research beyond a single chart
MFM combines current-market interpretation with an internal research environment. A single asset can be assessed relative to a benchmark, then compared across markets to examine whether the same structural logic remains visible under different conditions.
Place the asset beside a relevant benchmark and assess relative position, leadership, lagging behaviour and structural divergence.
Study classification distribution, duration, transitions, temporal stability and separation within the active dataset.
Compare assets, providers, benchmarks and timeframes to evaluate consistency, robustness and the limits of generalisation.
This combination is central to MFM: the Analysis Journey explains the current context, while the research environment tests whether that interpretation is sufficiently represented and structurally coherent.
A different analytical role
MFM does not replace indicators, market knowledge or professional judgement. It provides the missing structural layer between observation and interpretation.
Shows what happened: price, returns, volume and volatility.
Transform observations into measurements, thresholds or local signals.
Organises observations into structural context and explains their relationship.
Designed for structured inquiry
Add structural context to an existing investment process without outsourcing the decision.
Apply a consistent interpretive sequence across assets, providers and timeframes.
Study classification behaviour, stability, separation and generalisability.
Use explicit structural context and traceable outputs for downstream reasoning.
The MFM boundary
The framework observes market behaviour, reveals structural context, interprets the relationship and evaluates the available evidence. The final decision remains with the user.
Request more informationInterested in MFM?
For additional information about the Market Framework Model, the Analysis Engine, research applications or potential collaboration, contact Inratios.